
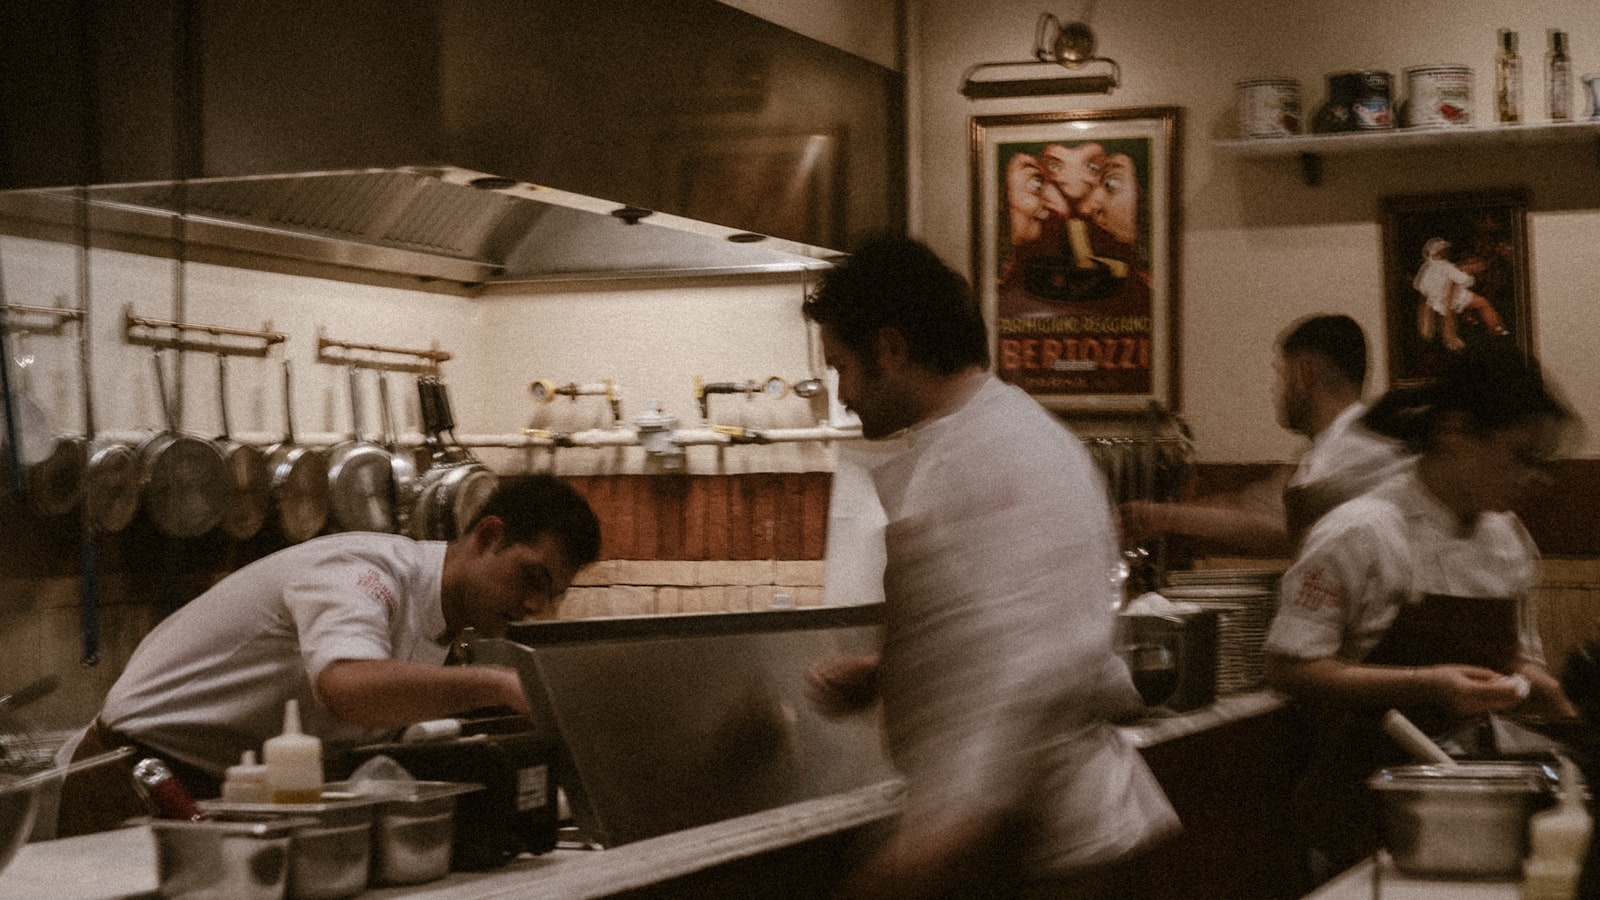
Sales per labor hour, which almost everyone shortens to SPLH, is what one hour of staffing produced in sales. You divide sales by the hours your team worked: $5,120 on a Friday over 44 hours is $116.36. That is the entire metric, and the reason operators bother with it is the gap it closes.
Here is that gap. You scheduled five cooks on a Tuesday. Service ran fine, nobody was standing around looking bored, nobody was in the weeds. So the schedule was right, presumably. Then the P&L closes 30 days later, labor is three points over where it should be, and you are trying to reconstruct which of the last 30 Tuesdays was the problem.
SPLH uses two facts you already have at close, what you sold and how many hours your team worked, and answers that question the same night. This guide covers what it actually measures, how to calculate it, what a good number looks like for different service models, how it differs from labor cost percentage, and the levers that genuinely move it. There is a free calculator partway down, plus a look at what daily tracking looks like in practice.
What Sales Per Labor Hour (SPLH) Means
Most restaurant numbers describe money. SPLH describes an hour, which is why it behaves differently from everything else on your reports. An SPLH of $95 does not mean you spent $95 or made $95 in profit. It means every hour of staffing you put on the floor turned into $95 of sales.
The thing that makes it useful is what it leaves out. SPLH says nothing about pay rates. A restaurant that pays well and a restaurant that pays poorly can post identical SPLH numbers, because the metric only looks at hours and sales. That sounds like a limitation until you realize it is the entire point: SPLH isolates productivity from price of labor. When it moves, it moved because of how the operation ran, not because you gave someone a raise.
Why restaurants use it instead of a percentage
Most operators grew up on labor cost percentage, and it is a perfectly good number. It just moves for reasons that have nothing to do with your schedule. Raise your menu prices and labor percentage improves overnight while not one thing about the operation changed. Give the team a well-deserved bump and it worsens, even if service got better.
SPLH does not have that problem. It is denominated in hours, and an hour is an hour. When SPLH drops, either sales softened or you put too many hours against the volume you had. Those are both things a manager can act on before the shift repeats.
Sales per man hour (SPMH) is the same number
You will run into a few names for this. Sales per man hour, or SPMH, is the older term and shows up in legacy POS reporting and in retail. Revenue per labor hour is another. They are all sales divided by hours worked. If a vendor report uses a different label, check the formula rather than assuming it is a different metric, because in nearly every case it is not.
The Sales Per Labor Hour Formula
The math is as simple as restaurant math gets.
SPLH = Total Sales ÷ Total Labor Hours
Both halves have to cover the same period. Friday's sales over Friday's hours. A week of sales over a week of hours. Mixing periods is the single most common way people get a number that looks plausible and means nothing.
What counts as sales
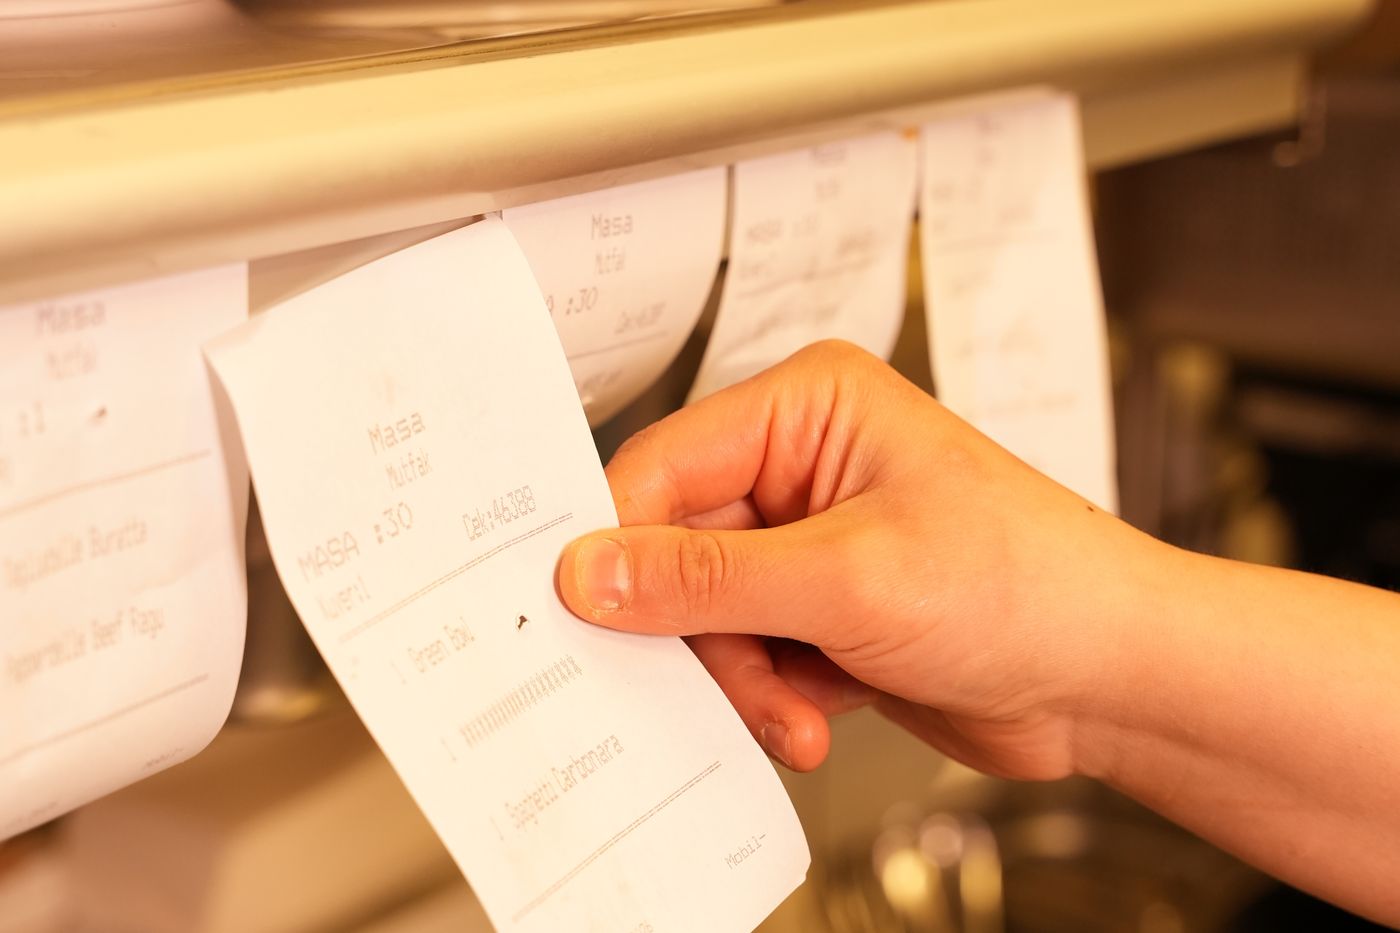
Use net sales, meaning after comps, voids, and discounts, and before tax. Whether you include delivery orders is your call, but make the call once and stick with it. Third-party delivery is worth thinking about here: those orders consume kitchen hours, so leaving them out of sales while their labor stays in the denominator will drag your SPLH down for no real reason.
What counts as labor hours
This is where the number gets made or broken. Every hour worked by everyone in the group you are measuring, whether that is the whole house or just the kitchen. The judgment calls that matter:
- Prep and receiving hours. They are real hours, and they belong in the denominator if you want an honest kitchen number.
- Salaried managers. Most operators leave them out, since their hours do not flex with volume. Whatever you choose, apply it every single day.
- Clock-in drift. If people clock in 15 minutes early out of habit, that is roughly an extra hour a day of denominator across a small crew. Use actual clocked hours, not scheduled hours, or you are measuring your intentions instead of your operation.
The rule underneath all of it: consistency beats precision. A slightly wrong definition applied identically every day still produces a usable trend. A perfect definition that changes every few weeks produces nothing.
Your numbers hold whether you’re there or not.
The whole operation in one place, built around the way your restaurant already works. Money stops leaking, your time stops disappearing into follow-up, and every shift leaves a record with a name on it.
How to Calculate SPLH: A Worked Example
Take a real Friday in a mid-size kitchen. The restaurant is measuring back of house only, so the sales figure is food sales and the hours are kitchen hours.
Friday, kitchen only
- Net kitchen sales
- $5,120
- Cooks: 3 people × 9 hours
- 27 hrs
- Prep: 1 person × 6 hours
- 6 hrs
- Dish: 1 person × 8 hours
- 8 hrs
- Expo: 1 person × 3 hours
- 3 hrs
- Total kitchen hours
- 44 hrs
- SPLH ($5,120 ÷ 44)
- $116.36
On its own, $116.36 means very little. It becomes information the moment you have something to compare it to. Say the previous four Fridays ran $121, $118, $124, and $119. This Friday came in low, and the gap is not dramatic, but it is the same direction two weeks running.
Now look at the same restaurant whole-house on the same night, adding front of house sales and hours:
Friday, whole house
- Net sales (food + beverage)
- $12,400
- Kitchen hours
- 44 hrs
- Front of house hours
- 67 hrs
- Total labor hours
- 111 hrs
- SPLH ($12,400 ÷ 111)
- $111.71
Two numbers, same night, both correct, and not comparable to each other. That is worth internalizing before you start reporting on this. Kitchen-only SPLH divides a smaller sales figure by a much smaller hour count, and depending on your beverage mix it can land above or below the whole-house figure. Label every SPLH number with what it covers, every time.
Free Sales Per Labor Hour Calculator
Drop your numbers in. It runs both directions: enter sales and hours to get your SPLH, and set a target to see how many hours that target actually allows you.
SPLH calculator
Use one shift or one day. Net sales, actual clocked hours.
Enter a target to see the hour budget it implies at your current sales.
The second half of that calculator is the part managers tend to find useful. A target SPLH is really an hour budget in disguise, and turning it into a headcount conversation before the schedule gets posted is far more productive than reviewing it after the fact.
What Is a Good Sales Per Labor Hour?
Here is the honest answer: your own last 90 days is a better benchmark than anything you will read online, including this table. SPLH is driven by check average and service model, so a counter-service taqueria and a tasting-menu restaurant will never share a target, and neither one is doing anything wrong.
That said, operators do ask for a starting range, so here is a directional one for whole-house SPLH.
| Service model | Typical whole-house SPLH |
|---|---|
| Coffee shop / bakery café | $40 – $70 |
| Quick service / counter | $45 – $75 |
| Fast casual | $60 – $95 |
| Casual full service | $70 – $110 |
| Bar-led / high beverage mix | $90 – $150 |
| Upscale / fine dining | $110 – $180 |
Two cautions on using any table like this. First, these are whole-house figures, and a kitchen-only number is a different calculation that will not line up against them. Second, a restaurant sitting at the top of its range is not automatically winning. An SPLH that is unusually high often means the team is underwater, and understaffing shows up later as burnout, turnover, and slipping reviews rather than as a bad number this week.
The useful version of the question is not "what is a good SPLH." It is "is mine trending up or down, and do I know why." For the same reason, it pays to read SPLH alongside your restaurant labor cost percentage rather than instead of it.
SPLH vs. Labor Cost Percentage
These two get treated as competitors. They are not. They answer different questions, and running them together is what makes either one trustworthy.
| SPLH | Labor cost % | |
|---|---|---|
| Formula | Sales ÷ hours | Labor $ ÷ sales |
| Answers | What labor produced | What labor cost |
| Affected by pay rates | No | Yes |
| Affected by menu prices | Yes | Yes |
| Best read | Daily | Weekly / monthly |
| Acts on | Schedule shape | Total labor spend |
A worked case makes the difference concrete. Two Saturdays, same sales, same labor dollars, so identical labor cost percentage. On the first, you ran six people for eight hours each. On the second, you ran eight people for six hours each. Same 48 hours, same SPLH too. But now change it: the second Saturday you ran eight people for eight hours and pushed the same sales. Labor percentage barely moves if those extra hands are your lowest-paid staff. SPLH drops immediately, from $258 to $194, and tells you the schedule was heavy.
That is the case for having both. Percentage catches the spend. SPLH catches the shape.
How to Track SPLH Daily
SPLH earns its keep on a daily cadence, and loses most of its value on a monthly one. A number that arrives with the P&L is a historical record. A number that arrives at close is a management tool, because the same crew is working the same shift again in seven days and you can still change it.
Practically, daily tracking needs three things: one person who owns the entry, a fixed time it happens, and a place to put it where the trend accumulates. The owner is usually the closing manager, and it belongs in the close routine alongside everything else on your daily operations checklist. It takes about ten seconds when the tool is right and about ten minutes when it lives in a spreadsheet nobody wants to open.
What ten seconds looks like
This is the SPLH screen we build into Crewli. The closing manager enters the date, kitchen sales, and kitchen hours. The SPLH figure resolves live as the digits land, so you see $116.36 before you even hit save.
Underneath, the 7-day and 30-day averages update, the last 14 entries render as a trend, and history is available at 7, 30, and 90 days. Access is manager and owner only, since sales figures are not something most operators want visible to the whole team.
Real screen capture from the Crewli app, not a mockup.
Three rules make daily tracking survive past week two. Log it at the same point in the close every night, so it becomes muscle memory instead of a decision. Never skip a day, because gaps quietly break the averages that make the number readable. And review the 7-day average rather than reacting to any single day, since one large party or one call-out will swing a single shift far more than it should.
If your data currently lives across a POS, a scheduling app, and a spreadsheet, that friction is the actual reason the habit fails. It is the same problem we cover in our guide to building a coherent restaurant technology stack: the number of tools matters less than whether the numbers land in one place.
How to Improve Your Sales Per Labor Hour
There are exactly two directions. Raise the sales you produce in the hours you already staff, or produce the same sales in fewer hours. Everything else is a variation on one of those.
Raise the numerator
More sales against a flat schedule is the cleaner win, because it improves SPLH without asking anyone to do more with less.
- Check average. An extra $2 per guest across a busy Saturday moves SPLH meaningfully and costs zero additional hours. Most of the tactics in our guide to increasing restaurant sales land straight in this column.
- Peak throughput. Your staffing is already at its heaviest at 7pm. Turning one more table in that window is nearly free SPLH.
- Menu mix. Steering guests toward items that are quick to fire and carry margin raises sales per hour on both sides of the equation. Your menu pricing work feeds this directly.
Lower the denominator, carefully
Fewer hours is the lever people reach for first, and it is the one with a trap attached. Done well, it means removing hours that were not producing anything:
- Fix the shape, not the size. Most schedules are not overstaffed overall, they are overstaffed from 2pm to 4pm and thin at 7:30. Staggering starts in 30-minute increments against your actual sales curve usually finds hours nobody misses.
- Consolidate prep. Three people prepping four hours each often produces less than two people prepping five, because setup and cleanup cost is paid once per person.
- Cross-train. A cook who can also expo removes the need for a dedicated body on slower nights. This is where real staff training pays for itself in a line item you can see.
- Look at the room. Station distance, pass placement, and dish path decide how many steps a shift costs. A working kitchen layout raises SPLH permanently, which almost no scheduling change does.
Do this
- Stagger start times against the sales curve
- Cut the hours nobody is producing in
- Compare Tuesday to Tuesday
- Manage the 7-day average
- Cross-train so one body covers two roles
Not that
- Cut an hour off everyone across the board
- Send the crew home mid-rush to protect a number
- Compare Tuesday to Saturday
- React to one bad night
- Run a skeleton crew and call it efficiency
The trap deserves its own sentence, because it catches good operators. SPLH will rise if you cut deep enough, right up until service quality drops, and the sales decline that follows shows up a month later where it is hard to trace back to the schedule. If SPLH is climbing while your reviews and repeat visits soften, you are not getting more efficient. You are borrowing from next quarter.
Five Mistakes That Make SPLH Useless
The metric is simple enough that most failures come from how it gets handled rather than from the math.
- Changing what counts, mid-stream. Adding prep hours to the denominator in month three makes month three look worse than month two for no operational reason. Every definition change resets your history.
- Mixing kitchen-only and whole-house figures in one report. They differ by a wide margin and the comparison is meaningless. Label them and keep them apart.
- Comparing across dayparts and days. A Tuesday lunch and a Saturday dinner are different businesses. Compare like to like, which in practice means same weekday, same daypart.
- Reacting to a single shift. One night is noise. A 7-day average moving three weeks in a row is a signal.
- Leaving sales figures open to everyone. Most owners do not want revenue visible to the whole staff. If the number lives in a shared spreadsheet, that decision has already been made for you. Whatever you use should keep it to the managers who own the number.
For broader context on where labor productivity sits among the numbers worth watching, the Bureau of Labor Statistics publishes industry data for food services and drinking places, and the National Restaurant Association's research library tracks operating trends across service models.
None of this works as a standalone metric, and it is not supposed to. SPLH is one instrument on a dashboard that also includes food cost, cover counts, and labor percentage. What it contributes that the others do not is speed, since it is available at close on the night the decision was made. If you want the full picture of the systems that number sits inside, start with our complete guide to restaurant operations.
If you want SPLH tracked daily without another spreadsheet nobody opens, that is the kind of thing we build. Crewli is a fully custom operations app shaped around how your restaurant actually runs, which means the numbers you care about land in one place and the people who should see them are the only ones who do. Let's talk.
Frequently Asked Questions
What is sales per labor hour (SPLH)?
Sales per labor hour, usually shortened to SPLH, is how much revenue your restaurant earns for every hour someone was on the clock. You divide sales for a period by the labor hours worked in that same period. If you did $5,120 in sales on a Friday and your team worked 44 hours, your SPLH is $116.36. It is a productivity measure rather than a cost measure, which is what separates it from labor cost percentage.
What does SPLH stand for?
SPLH stands for sales per labor hour. You will also see it written as sales per man hour, or SPMH, which is the same calculation under an older name that is slowly falling out of use. Some operators use revenue per labor hour, which again is the same math. Whichever label your POS or scheduling software uses, the formula is sales divided by hours worked for the same period.
How do you calculate sales per labor hour?
Divide total sales by total labor hours for the same period. Pick a period first, usually one day or one shift, then pull net sales for that period and add up every hour worked by everyone you are measuring. Consistency matters more than precision: if you count prep hours one week, count them every week. Changing what goes into the denominator is the fastest way to make the number meaningless.
What is a good sales per labor hour for a restaurant?
It depends heavily on your service model and your check average, so a single universal target does not exist. Counter service commonly lands lower than full service, and fine dining lands highest because check averages are higher. Rather than chasing an industry figure, calculate your own SPLH for the last 90 days and treat that as your baseline. A rising trend against your own history tells you more than a comparison to a restaurant with a different menu and price point.
What is the difference between SPLH and labor cost percentage?
Labor cost percentage divides what you paid by what you sold, so it answers what labor cost you. SPLH divides sales by hours, so it answers what your labor produced. The practical difference is that SPLH is not affected by pay rates, which means it isolates productivity. A schedule can look fine on labor percentage and still be badly shaped, and SPLH is what surfaces that.
How often should I track sales per labor hour?
Daily, with a rolling 7-day and 30-day average next to it. The single-day number is noisy because weather, a large party, or one call-out will swing it. The averages are what you actually manage against. Tracking it monthly off the P&L defeats the purpose, because by then the schedule that caused the problem is 30 days old and you have already paid for it.
How can I improve my restaurant's SPLH?
There are only two directions: raise sales in the hours you are already staffing, or produce the same sales in fewer hours. The first comes from check average and throughput at peak. The second comes from schedule shape, cross-training, consolidating prep, and station layout. Blanket hour cuts are the one approach that reliably backfires, because service quality drops and next month's sales drop with it.
Should I calculate SPLH for the whole restaurant or just the kitchen?
Both are useful and they answer different questions. Whole-house SPLH tells you whether the operation overall is productive. Kitchen-only SPLH isolates the back of house, which is where schedules tend to drift without anyone noticing. The two are not comparable in either direction: kitchen-only divides food sales by kitchen hours, whole-house divides all sales by all hours, so which one reads higher depends on your beverage mix and how you staff the floor. Pick one for each report and label it clearly.